
CLASSES ↑ beginner to advanced ↓
CONVERSION RATE ACADEMY
Advanced Analytics: Scroll Depth, Rage Clicks, and More
Basic analytics tells you what happened. Advanced behavior analytics tells you why it happened. This class covers key behavioral signals – scroll depth, rage clicks, dead clicks, and hesitation – and how to convert them into experiments.
Signals and what they usually mean:
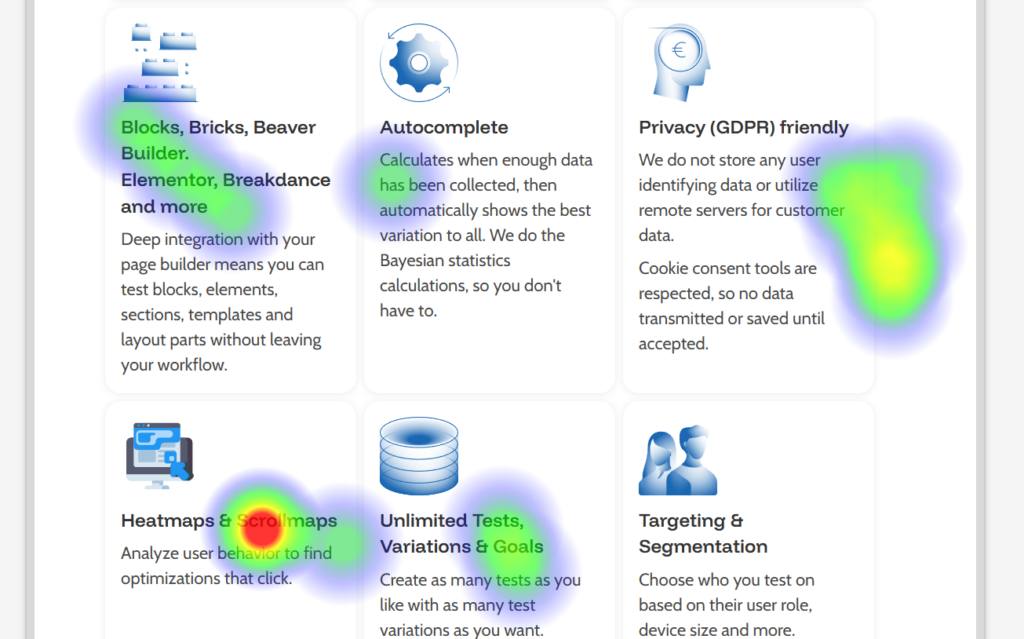
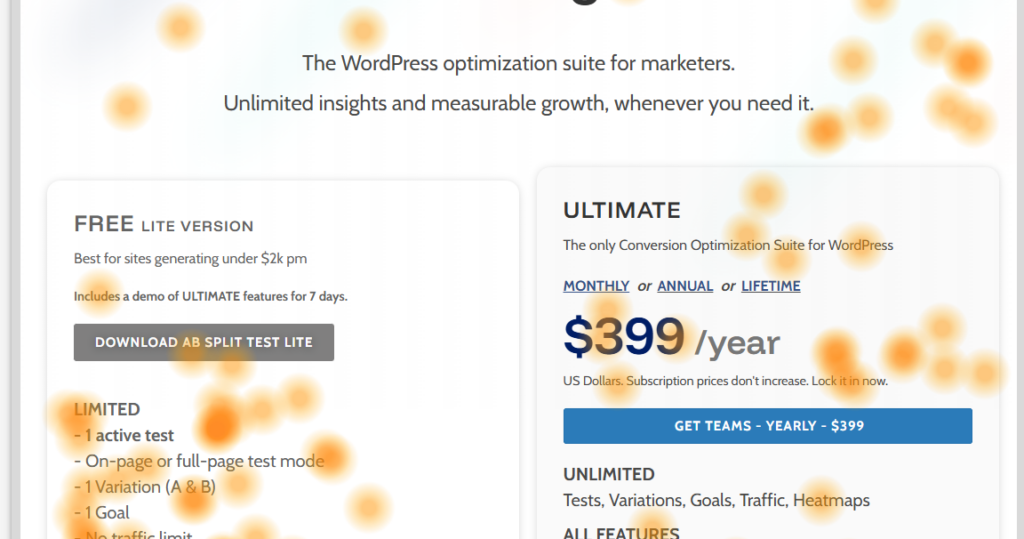
- Scroll depth drop-off: users aren’t reaching key info → move proof/pricing/CTA up.
- Rage clicks: frustration or broken expectations → fix UI, make elements clickable, clarify steps.
- Dead clicks: users think something should work → add links, buttons, or clearer affordances.
- Hesitation loops: users don’t interact or browse pages for a long time → unclear offer or trust gap.
Turn a signal into a test:
- Identify the signal on a specific page/section.
- Confirm with session replays (what happens right before exit?).
- Decide the most direct fix (clarify, reposition, reduce choices, add proof).
- Test the smallest viable change first.
AB Split Test workflow: Use heatmaps + session replays to triangulate: where attention goes, where frustration happens, and what users do next. Ask the AI CRO chat to propose experiments specifically for the signal you found (“rage clicks on pricing toggle” → “add explanation + default recommended plan”).