
CLASSES ↑ beginner to advanced ↓
CONVERSION RATE ACADEMY
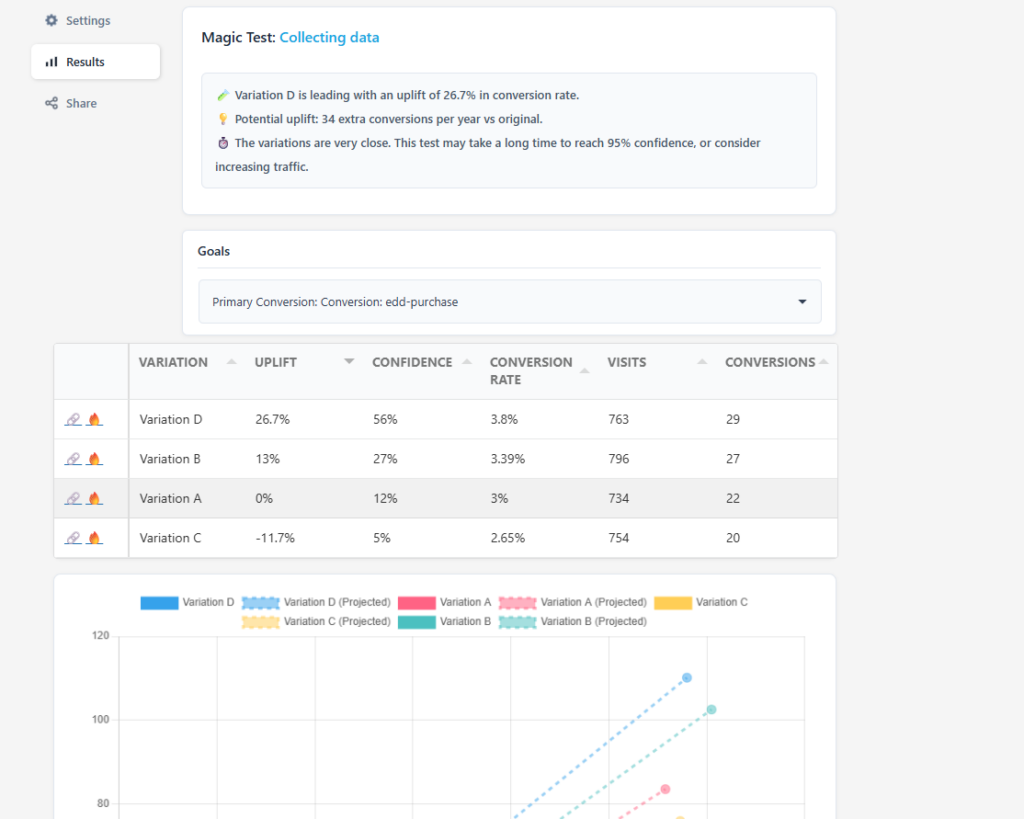
Basic Stats for CRO: Reading Test Results
When you open a test results screen, it’s tempting to jump straight to the uplift column and declare a winner.
That instinct is exactly how teams ship false positives.
This article explains what each row and column means, and why you often need to wait.
Start With the Core Idea
Testing doesn’t ask:
“Which variation looks best right now?”
It asks:
“Based on the data we’ve collected so far, how confident are we that this result is real?”
Every row in your results table is a snapshot of partial information. Early on, the numbers are unstable. Over time, they harden into something you can trust.
Column-by-Column Breakdown
Variation
This is simply the version of the page or element being tested.
Variation A is usually the control (your current version)
Variations B, C, D are alternatives designed to solve the same problem in different ways.
Visits
This is the number of users who were shown that variation.
Small sample sizes produce volatile results.
Early tests often show dramatic swings that later disappear.
If visits are low, confidence will be low, no matter how exciting the uplift looks.
Conversions
This is how many of those visitors completed the primary goal (purchase, signup, etc.).
Important:
A difference of just 2–3 conversions can massively change early percentages.This is why “we’re up 30%!” is meaningless without enough data.
Raw counts matter more than percentages early on.
Conversion Rate
This is simply:
conversions ÷ visits
It’s useful for comparison, but it is not proof.
Two variations can have different conversion rates purely due to randomness – especially with low traffic.
Uplift
Uplift shows how a variation performs relative to the control.
Example:
+26.7% uplift means this variation is converting 26.7% better than the control so far.
Key phrase: so far.
Uplift answers:
“If this trend holds, how much better is this version?”
It does not answer:
“Is this result real?”
That’s what confidence is for.
The Most Important Column: Confidence
What Confidence Actually Means
Confidence answers one question:
“Based on the data we have, how likely is it that this result is not due to chance?”
A confidence of:
56% means there is still a 44% chance this result is noise
95% means there is only a 5% chance this result is random
Until confidence is high enough, you are guessing.
Why Confidence Starts Low (and That’s Normal)
Early in a test:
Sample sizes are small, Random variation dominates, Leaders change frequently
This is expected behavior.
Why Close Variations Take Longer
When conversion rates between variations are similar, tests needs more traffic to separate signal from noise & confidence grows slowly.
Why You Should Not Stop Early
Stopping early:
Locks in random winners
Creates false learning
Slowly degrades performance over time
The most dangerous tests are the ones that look decisive early but weren’t allowed to mature.
Potential Uplift (Projected)
This estimate translates uplift into real business impact over time.
Example:
“34 extra conversions per year”
This is a projection of the additional uplift from the default projected over 12 months.
It only becomes reliable after confidence is high.
Use it to:
Prioritize patience
Decide whether the upside is worth waiting for
When to Act
You should consider acting when:
Confidence is high enough for your risk tolerance (usually 95%)
The result aligns with your hypothesis
Guardrail metrics look healthy
Until then, the correct action is usually:
Wait and send more traffic.