
CLASSES ↑ beginner to advanced ↓
CONVERSION RATE ACADEMY
Generating Ideas from Heatmaps and Click Maps
Click maps show exactly where visitors click – even when it isn’t on a link. This helps you see what attracts attention and what may be confusing.
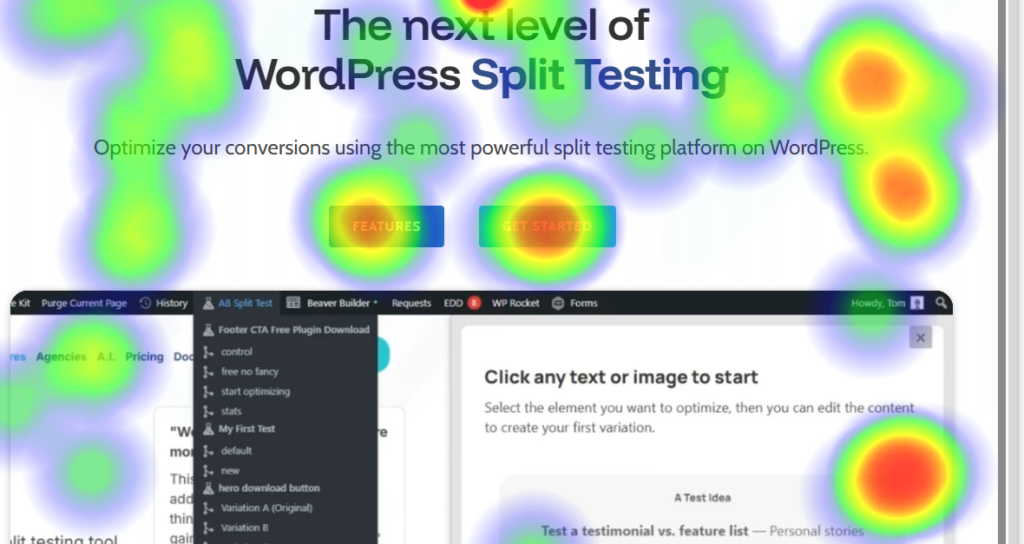
What Click Maps Reveal
1. Non-clickable elements getting clicks
Visitors often click images or graphics that aren’t links. This usually means they expect more information or navigation there.
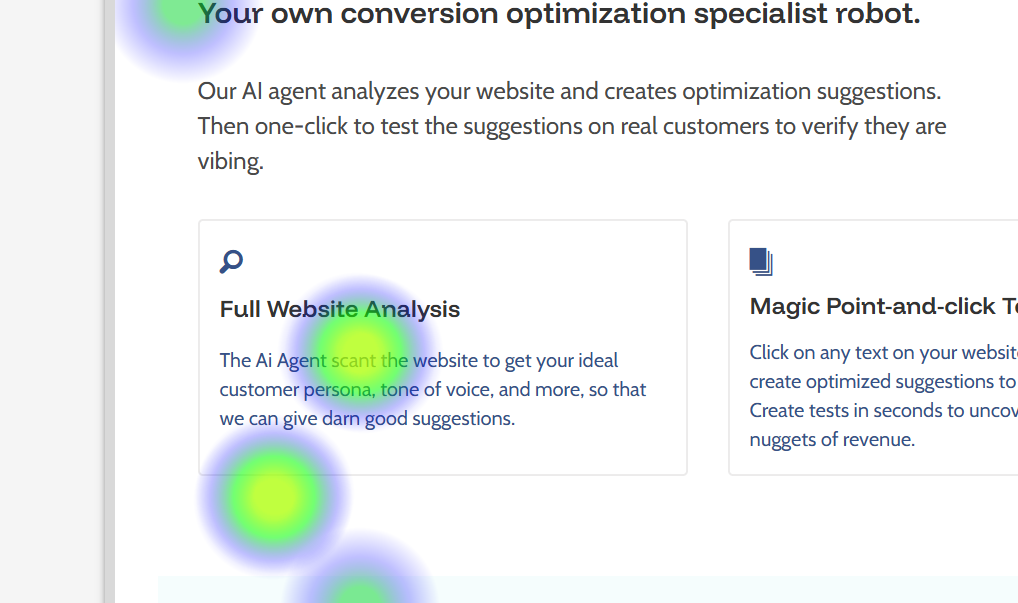
2. Which parts of the page get attention
Click maps quickly show the areas visitors focus on, making them useful even for people without analytics experience.
3. Which links people actually use
If several links go to the same page, click maps show which one visitors prefer.
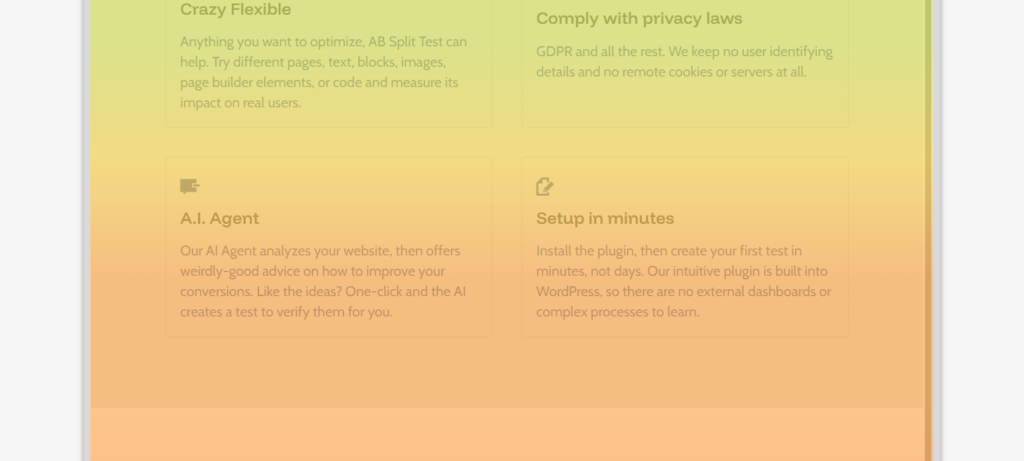
4. How far visitors scroll
Scroll maps reveal which sections are viewed most and whether visitors stop early – sometimes because the design looks like the bottom of the page.
How to Use Them Properly
Study click-mapping reports for:
- your most important pages (traffic or revenue)
- pages that may have usability issues
Ignore obvious patterns and focus on anomalies – unexpected behavior is where insights come from.
Turning Observations into Tests
When you see something unusual:
- Identify what visitors are doing.
- Decide what they might be expecting.
- Adjust the page to match that expectation.
- Test the change.
Example:
If users click a product image, consider making it expandable or linking to more details.
Important Limitation
Click maps show what happened, not why.
Use them alongside other tools – such as session recordings – to understand how visitors behaved on the page and where they struggled.