
Heatmaps, Clickmaps, and Scrollmaps Are Now Built Into AB Split Test

You can now see exactly where visitors click, scroll, and focus on your pages right inside WordPress.
With our Heatmaps, Clickmaps, and Scrollmaps feature in the AB Split Test Teams plan, you can now see exactly how people interact with your WordPress pages and test variations, right inside your dashboard.
This feature gives you detailed visual insights into where visitors click, scroll, and focus their attention. Whether you’re running an A/B test or just analyzing a single page, heatmaps make it easy to understand user behavior and guide smarter design decisions.
See What Visitors Actually Do
Every time someone visits a page under test, AB Split Test automatically records:
-
Heatmaps: where attention and clicks cluster
-
Clickmaps (Confetti mode): displays every individual click, helping you see exactly which spots grab attention and which are ignored.
-
Scrollmaps: show the percentage of people reaching each section of a page, highlighting where engagement drops off.
All without leaving your WordPress dashboard.
How To Get Started
-
Make sure you’re on the Teams plan.
-
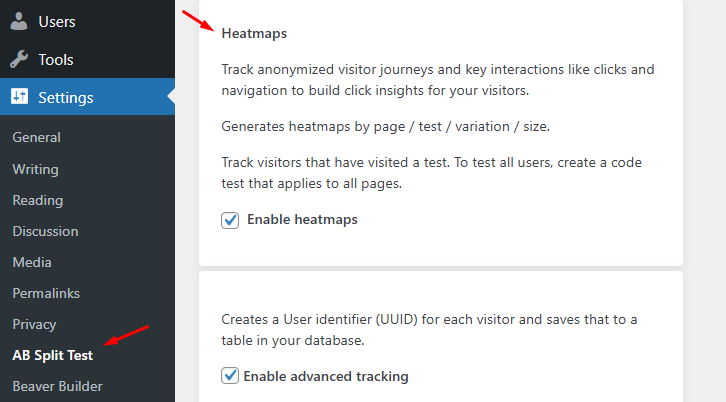
Go to Settings → AB Split Test.
-
Enable Heatmaps and save your settings.
From there, every visitor that sees a test variation will automatically have heatmap data recorded.
Viewing Your Heatmaps
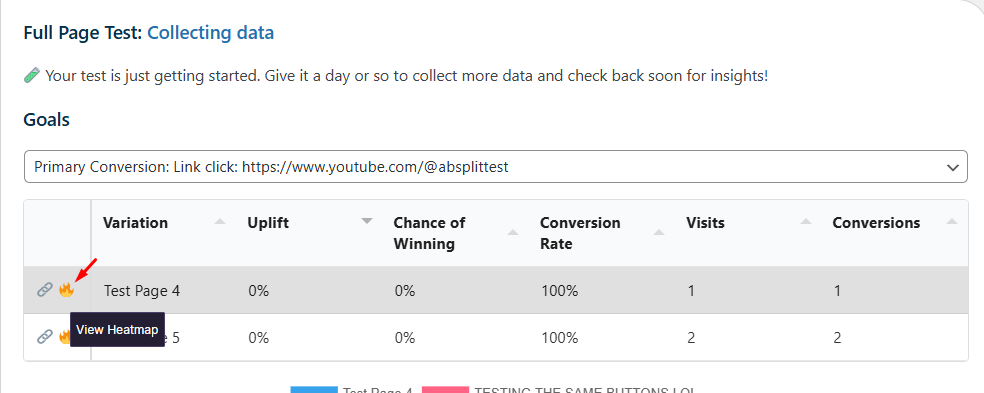
When enough data has been collected, visit your Heatmaps page to choose the page or test variation you want to analyze. You can filter by screen size (small, medium, or large) to see how visitors behave across different devices. For each variation, just click the fire icon to view your heatmap data.
Open the Heatmaps page in your dashboard and choose the page you want to review.

Or open a specific test and click the 🔥 icon beside the variation. Select a screen size (small, medium, or large) to see heatmaps for that device range.
In future updates, AB Split Test will let you filter by UTM parameters and more, making visitor insights even more granular.
Record Heatmaps On Any Page
Want to record heatmaps for a page that isn’t under test?
Create a code test with a single variation.
You can still segment recordings by user roles, device sizes, or specific conditions and even define a goal to measure conversions sitewide.
The test won’t visually change anything, but it will activate heatmap tracking for that page.
Why It Matters
Heatmaps take the guesswork out of optimization. You can instantly see:
-
Which parts of your page get attention
-
Where visitors stop scrolling
-
Which buttons actually get clicked
It’s the fastest way to decide what to test next without relying on assumptions.
Available Now
Heatmaps are live in AB Split Test version 2.2. Start tracking real user interaction today and use heat insights to fine-tune layouts, improve conversions, and make confident design choices.