
Track Real User Behavior With Privacy-First Heatmaps
Teams Included on the Teams plan. Not available on the Lite version. Upgrade →
What are heatmaps?
Heatmaps show you exactly where visitors click, how far they scroll, and where they get stuck on your pages. All recorded locally inside WordPress with no external scripts, no remote servers, and no third-party dependencies.
If you are already running split tests, you can view heatmap data per variation. That means you can see not just which variation performs better, but why.
What heatmaps record
Click maps Shows where visitors click across the page. Separates regular clicks, dead clicks (clicking something that is not interactive), and rage clicks (repeated frustrated clicking on the same element).
Scrollmaps Shows how far visitors scroll down the page. Use this to find where people stop reading and place your CTAs and key content where they will actually be seen.
Hover tooltips Hover over any element in the heatmap to see the click count, percentage of total clicks, and a description of that element. Added in v2.4.3.
Easy Setup
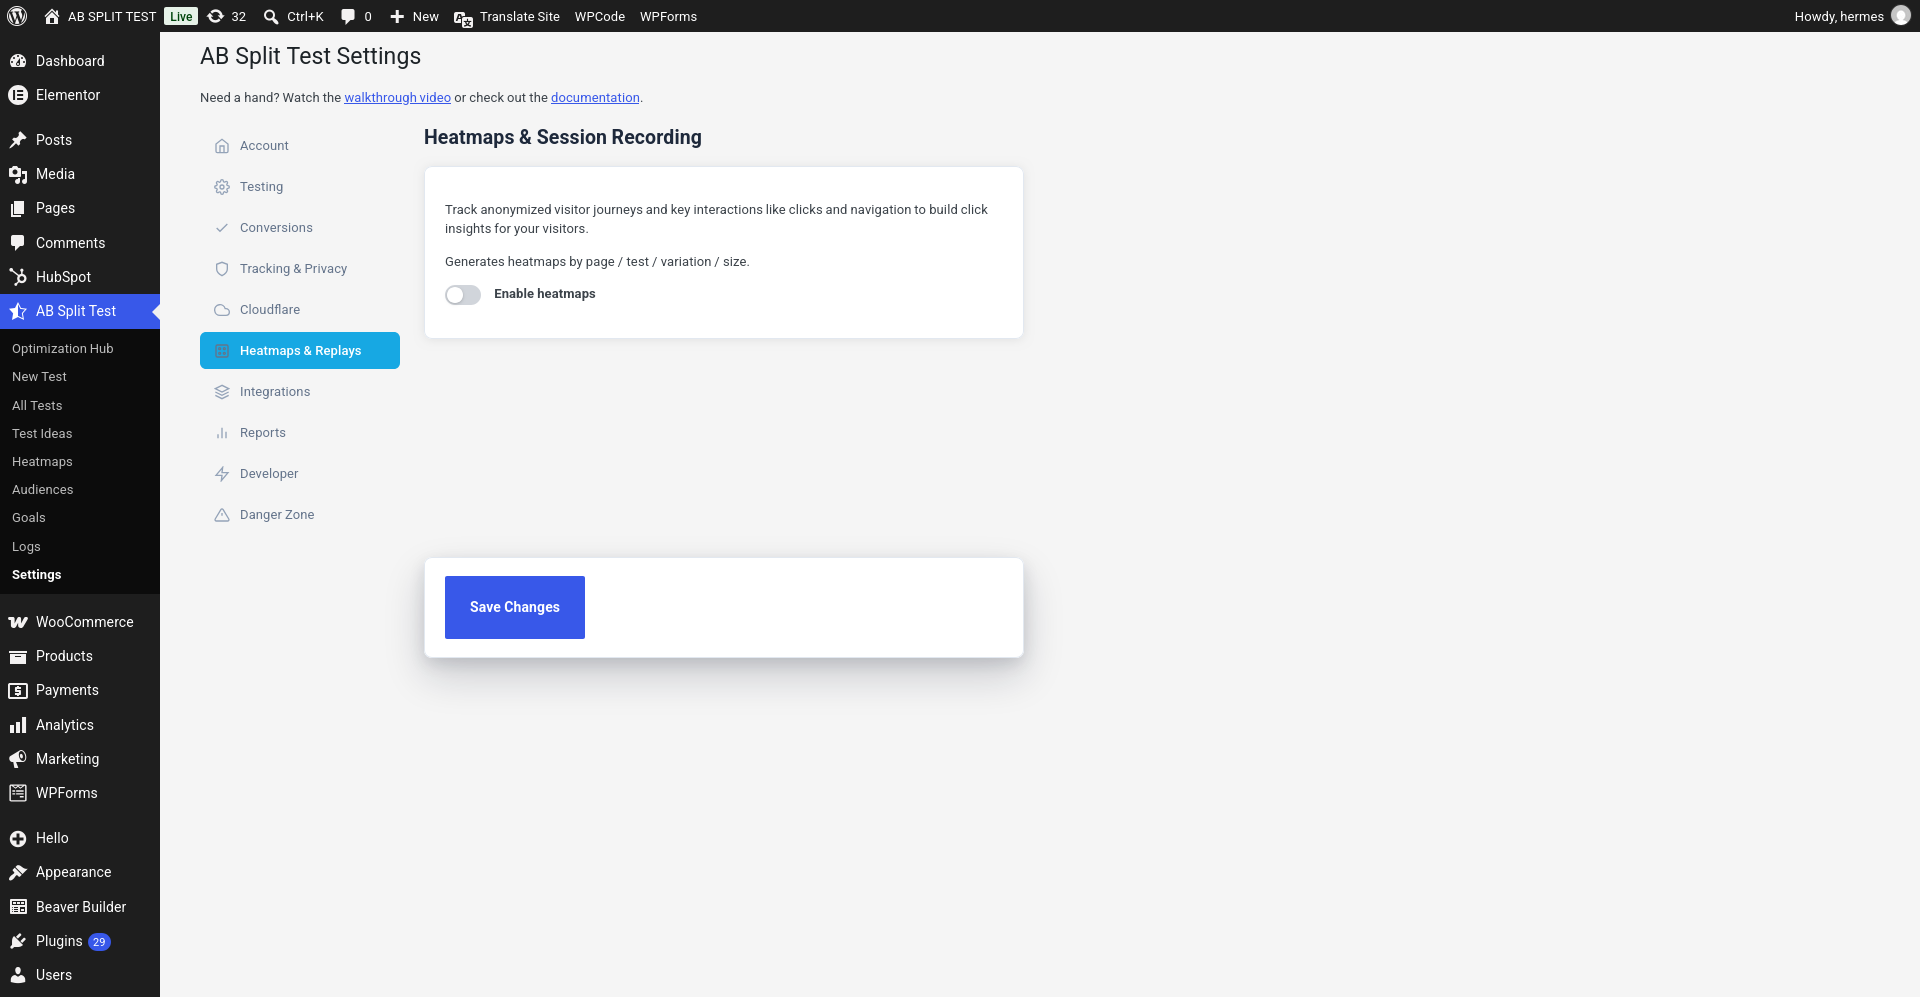
- Go to AB Split Test > Settings
- Open the Heatmaps & Replays tab and turn on Enable heatmaps
- Under Page Selection, choose Record all pages, or Record chosen pages and pick the pages to track, such as your homepage, pricing page, or checkout
- Click Save Changes
Heatmaps will start recording automatically for visitors on your active split tests and any pages you have selected.
Admins, editors, and authors are excluded from recordings by default so only real visitor behavior is logged.
Filtering heatmap data
You can filter your heatmap results to narrow down exactly what you are looking at.
Device size Filter by mobile, tablet, or desktop to see how behavior differs across screen sizes. Added in v2.5.1.
Exit URL Filter sessions by the URL visitors went to after leaving the page. Use this to understand where people are going when they leave and what behavior preceded that exit. Added in v2.5.2.
UTM parameters and referrer Filter by traffic source to compare behavior from different campaigns or channels. Added in v2.5.0.
The filter panel is collapsible and shows an active summary of which filters are applied. A re-render button is available to fix heatmap positioning on pages that use GSAP or scroll animations. Added in v2.5.2.
Pages you can track
Heatmaps work on any page type WordPress supports including pages, posts, custom post types, archive pages, taxonomy pages, and category list pages.
Data retention
Heatmap data is stored on your own server. The default retention period is 30 days. You can adjust this in Settings > Heatmaps & Replays under Data Retention. The Remove all Heatmap & Session Replay Data button is there too if you need to clear recordings.
Privacy and consent
All heatmap data stays on your server. Nothing is sent to external services. No remote cookies. No third-party tracking scripts.
If you use a cookie consent banner, go to Settings > Tracking & Privacy > Privacy - Cookie Consent and turn on Enable wait for approval. No data will be sent or saved until a visitor grants permission. Supported consent platforms include Borlabs, Complianz, CookieYes, WP Consent API, CookieConsent, Cookiebot, Termageddon, and GDPR Cookie Consent (WebToffee).
Combining heatmaps with split tests
When a split test is running, heatmap data is recorded per variation. You can view the heatmap for each variation separately to see how visitor behavior differs between them. Access this from the test's Results tab by clicking the 🔥 icon on any variation row.